 How climate science became the target of "the best-funded, best-organized smear campaign by the wealthiest industry that the Earth has ever known."
It's difficult to imagine how a guy who spends most of his time looking at endless columns of temperature records became a "fucking terrorist," "killer," or "one-world-government socialist." It's even harder when you meet Michael Mann, a balding 45-year-old climate scientist who speaks haltingly and has a habit of nervously clearing his throat. And when you realize that the reason for all the hostility is a 12-year-old chart, it seems more than a little surreal.
Back in 1999, Mann—then a newly minted Ph.D. (PDF)—and a pair of colleagues constructed a chart that plotted historical climate data, spanning from 1000 to 1980. Because recorded temperatures only begin in the late 19th century, Mann and his team largely relied on so-called proxy records—measurements of tree rings, coral, and ice cores whose variations illustrate temperature changes over the years.
The graph showed that after nearly 900 years of relatively stable temperatures, there was a sharp uptick starting in the 20th century.
You may have seen a version of the graph, known as the "hockey stick," in the film An Inconvenient Truth—the rise in carbon dioxide levels* is so steep, Al Gore uses a mechanical ladder to reach the most recent readings. The graph was featured prominently in a seminal 2001 report from the United Nations' Intergovernmental Panel on Climate Change (IPCC) that concluded, for its first time, that "the balance of evidence suggests a discernible human influence on global climate."
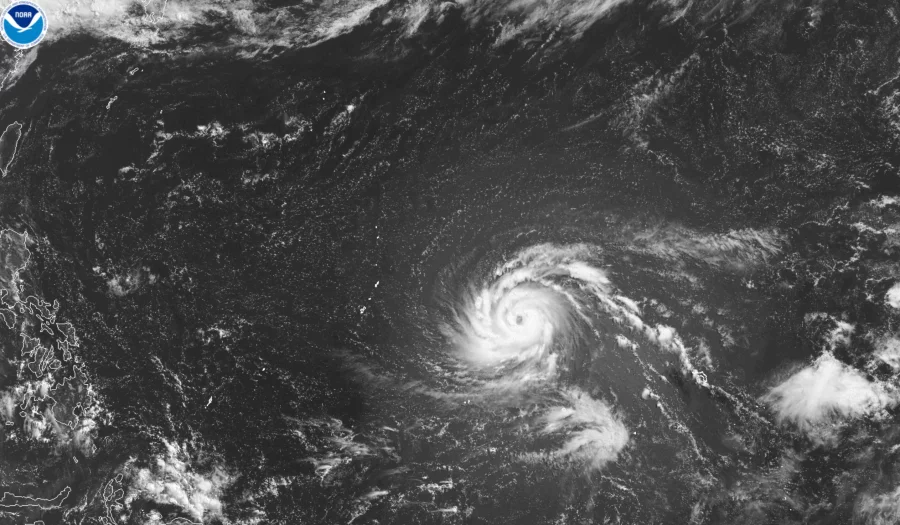 Super Typhoon Bavi is bringing intense winds to the remote U.S. territories of Guam and the...
 Floodwaters tore through Kentucky neighborhoods, damaging homes and streets as photos capture the aftermath.
Floodwaters tore through...
Floodwaters tore through Kentucky neighborhoods, damaging homes and streets as photos capture the aftermath.
Floodwaters tore through... A “prolonged, dangerous heatwave” was sweeping across parts of the central and eastern United States on...
 Hundreds of firefighters in Utah have struggled to suppress a wildfire that scorched an additional 20,000...